The SNP analysis feature in Strand NGS identifies the variants (SNPs/MNPs/InDels) in a sample by comparing the aligned reads against the reference genome. Based on the distribution of As, Ts, Gs, and Cs at a particular position, and the likelihood of a sequencing error, a judgment is made with regards to the existence of a SNP.
The SNP detection algorithm in Strand NGS works on a per-sample basis. For each sample, data for each chromosome is analyzed, with a capability for parallel computation per chromosome. The computation is optimized for memory usage by segregating the data into windows based on maximum read size.
Below we illustrate how the following three key analysis steps of interest can be performed in Strand NGS:
The SNP detection feature can be invoked on exome, whole genome and transcriptome samples. The first two types of samples can be loaded into Strand NGS as a DNA-Seq experiment. Transcriptome samples are loaded into Strand NGS as an RNA-Seq experiment. Once the experiment is created, the Sequence Analysis section of the Workflow pane on the right contains a step called SNP Detection.
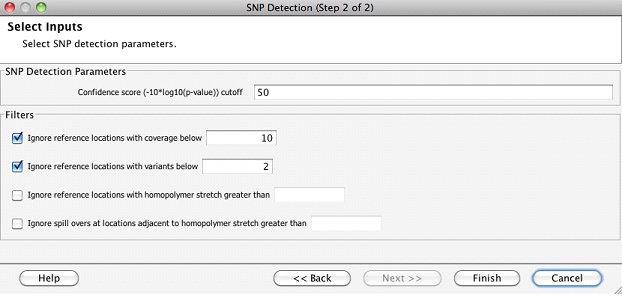
Clicking on this workflow step will enable the user to detect SNPs in a chosen read list. The chosen read list could be the list of all reads that were imported into the experiment, or any other filtered read list. In addition, the following parameters can be set for the SNP detection algorithm:
Once the SNP detection step finishes, a SNP results object is created in the navigator. Double clicking on the SNP result object launches the inspector which shows the numbers of different types of variants in each sample.
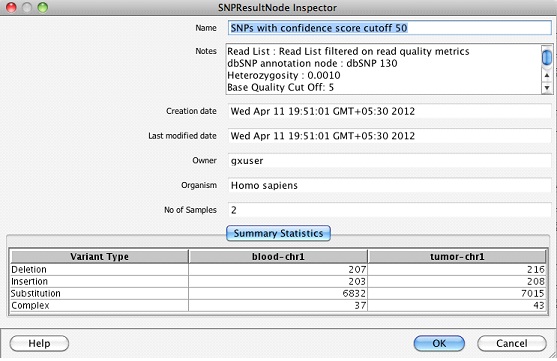
In addition, two folders called Single Base Variant Lists & Multi Base Variant Lists are created.
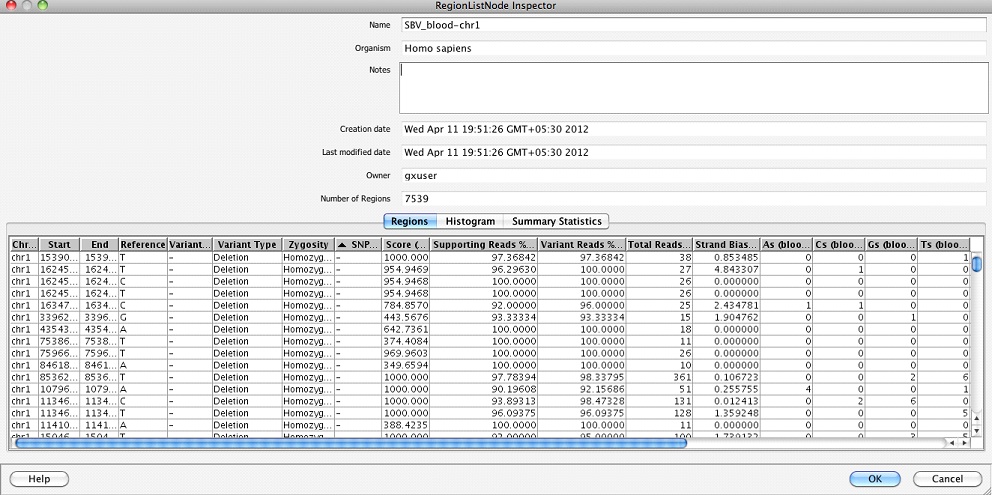
Single Base Variant Lists: This folder contains one region list per sample giving the single base substitutions, insertions, and deletions along with the zygosity, supporting reads %, ATGC composition, etc. at the variant location.
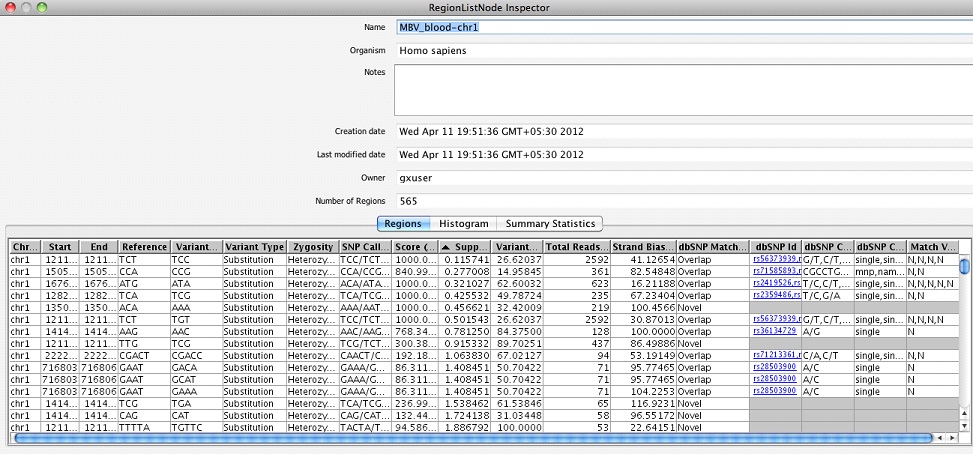
Multi Base Variant Lists: This folder contains one region list per sample giving the details of MNPs, multi-base insertions and deletions.
It is also possible to visualize these SNPs/InDels in a couple of intuitive ways:
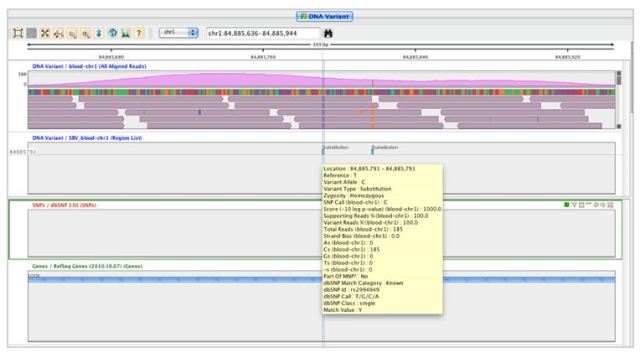
Dragging and dropping either the SNP results object, or the individual sample SNP result region lists into the genome browser will show all the SNPs and InDels in the genome browser. One can navigate over the SNPs in the genome browser very easily using the navigator buttons. The track can be filtered as well as colored on a variety of properties.
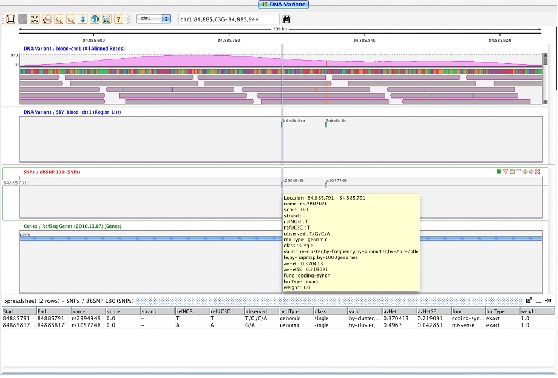
The other visualization is called the "Variant Support View" and can be invoked by right-clicking on the SNP results object. This view can also be launched from within the genome browser via the right-click menu on the read list track. It is especially useful for verifying heterozygous SNPs in a more convenient way.
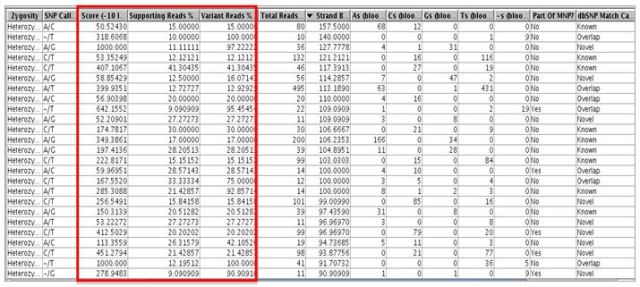
When SNP detection is invoked it allows setting a cut-off on the confidence measure (called 'score') of the SNPs. Also, the Variant Reads %, Supporting Reads % and the ATGC composition would help in validating the SNP calls, and could be used for further filtering if required.
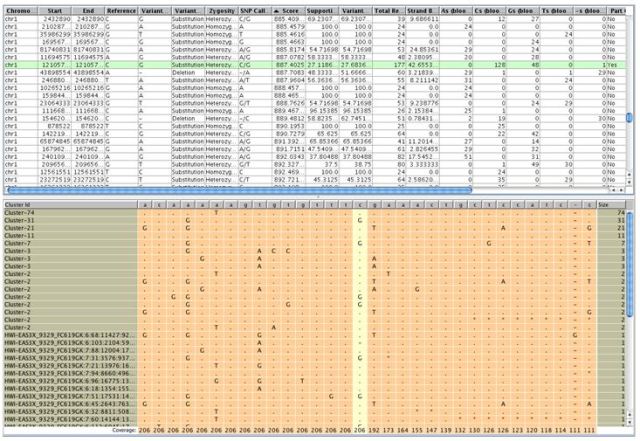
The score and other values for each SNP can be viewed in the SNP region list inspector as show below.
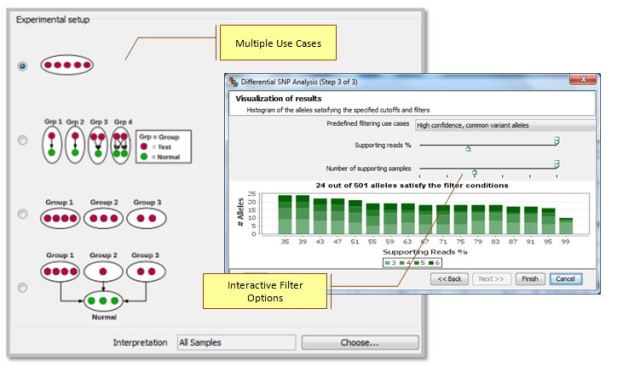
This workflow supports multiple experimental setups and can be used for quickly identifying population-specific variants, somatic mutations, and tumor specific markers via an intuitive graphical user interface.
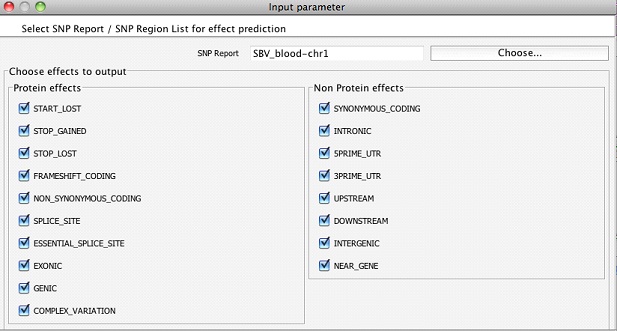
The biological consequences of SNPs can be identified by running the SNP Effect Analysis . To execute this step, the desired transcript annotations should have been chosen during the experiment creation step. For example, for human hg19 samples, one can choose to use Ensembl, RefSeq, or UCSC transcript annotations which could be downloaded through Annotations Manager. The effects of SNPs are categorized into various types and one could choose the effects of interest to be output while running SNP Effect Analysis as shown below.
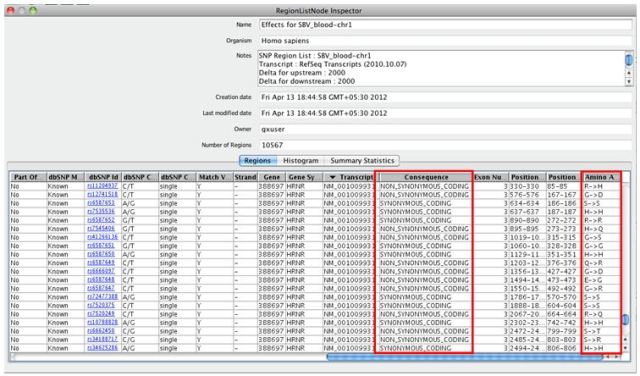
The resulting region list of a SNP Effect Analysis can be inspected as shown below:
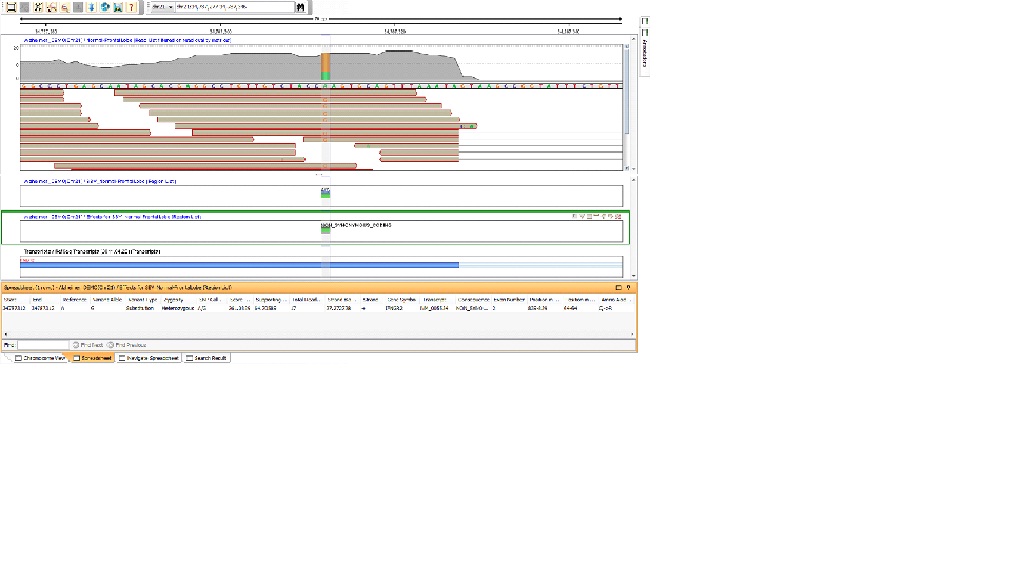
You can drag and drop the region lists created by SNP Effect Analysis into the genome browser and the corresponding view will look similar to the figure below.
If you have any question on this or any other features of Strand NGS, our software support is available around-the-clock by phone and email. Training and services can also be provided for diverse research requirements.
2018 © Strand Life Sciences Pvt Ltd. All rights reserved.


