In RNA-Seq experiments, the differential expression of genes and transcripts can be shown in a special visualization plot. The transcripts are displayed in an “idealized” fashion, where the introns are reduced and only the exons are shown in their original sizes. This allows for the display of the coverage of the reads on exons regardless of the size of the genes on the genome.
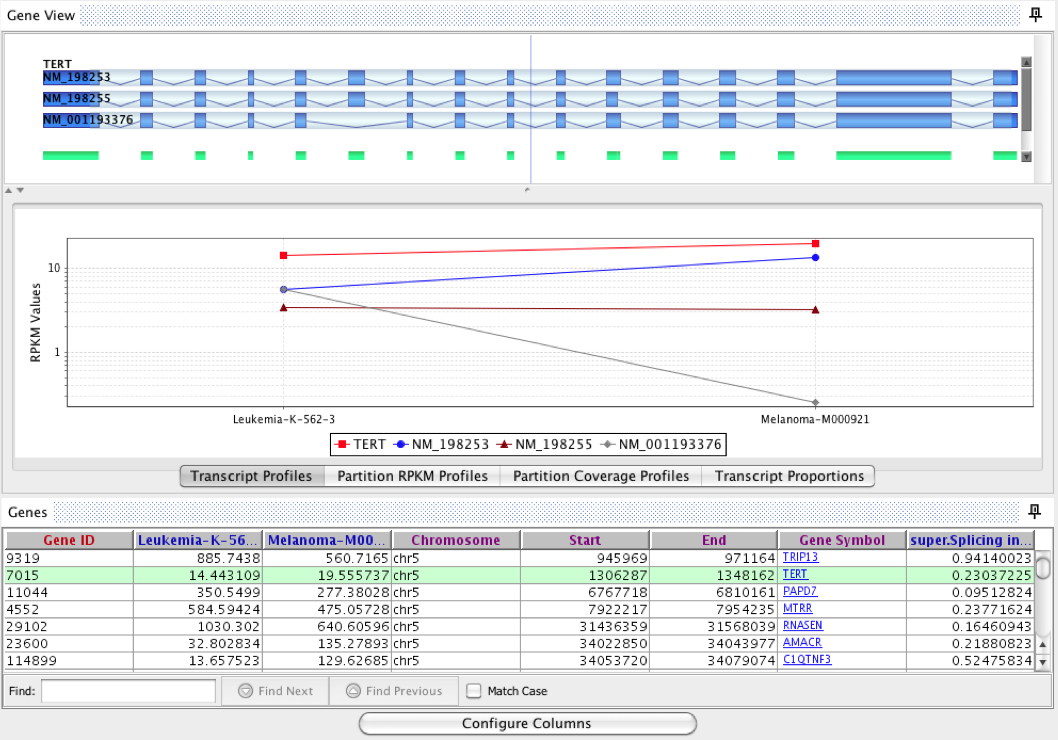
Expression values for a gene across conditions can be contrasted with the expression levels of individual transcripts above. Expression levels of individual transcripts are obtained via a deconvolution procedure.
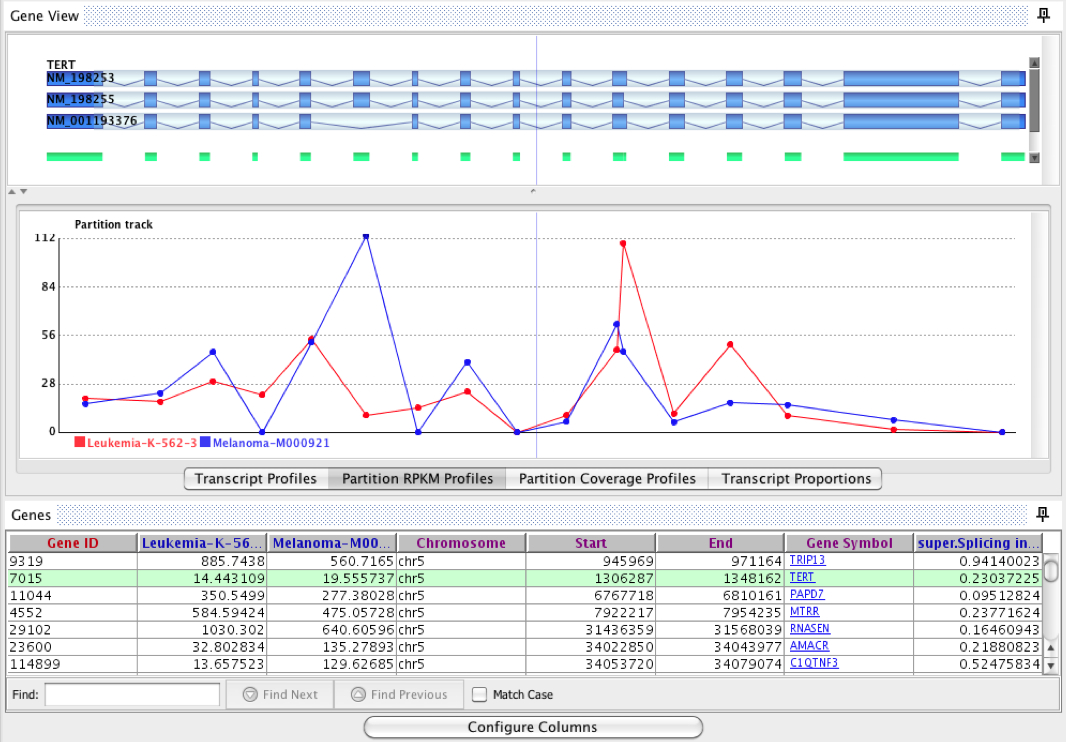
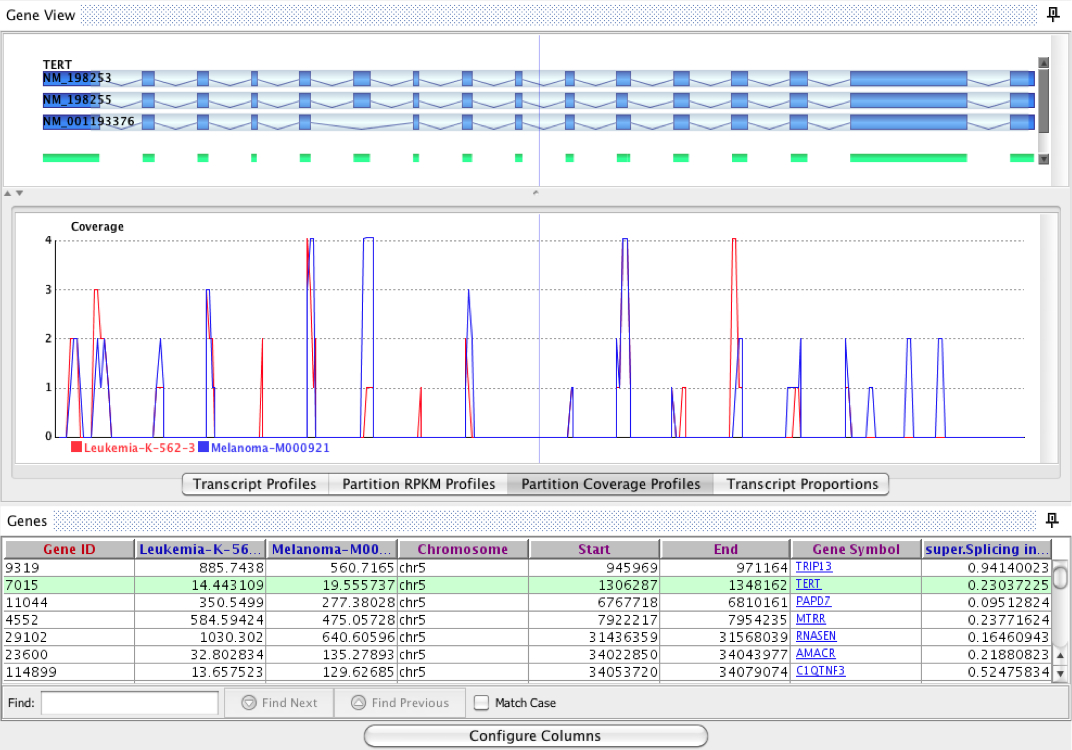
The expression levels for each exon for each of the conditions is shown above, making it easy to identify which exons are differentially spliced across conditions.
2018 © Strand Life Sciences Pvt Ltd. All rights reserved.


